Field Science in the 100-acre woods
Five weekends each semester, students dedicate part of their weekend to a “Saturday Class.” These classes are interdisciplinary, are generally active and exciting, and subsequently run longer than we initially expect. This weekend, Ned and I teamed up to launch a new project for science and math curriculum at the Alzar School. As spring has come early with sunshine and 70-degree days, many of us have been going for little jaunts in the woods along our greatly-improved perimeter trail. During these walks, I’ve reflected on how poorly I know our campus after three years and how foreign it must still seem to the students. So in an effort to help students develop a sense of place, we set students loose on a forest ecology investigation and mapping project.
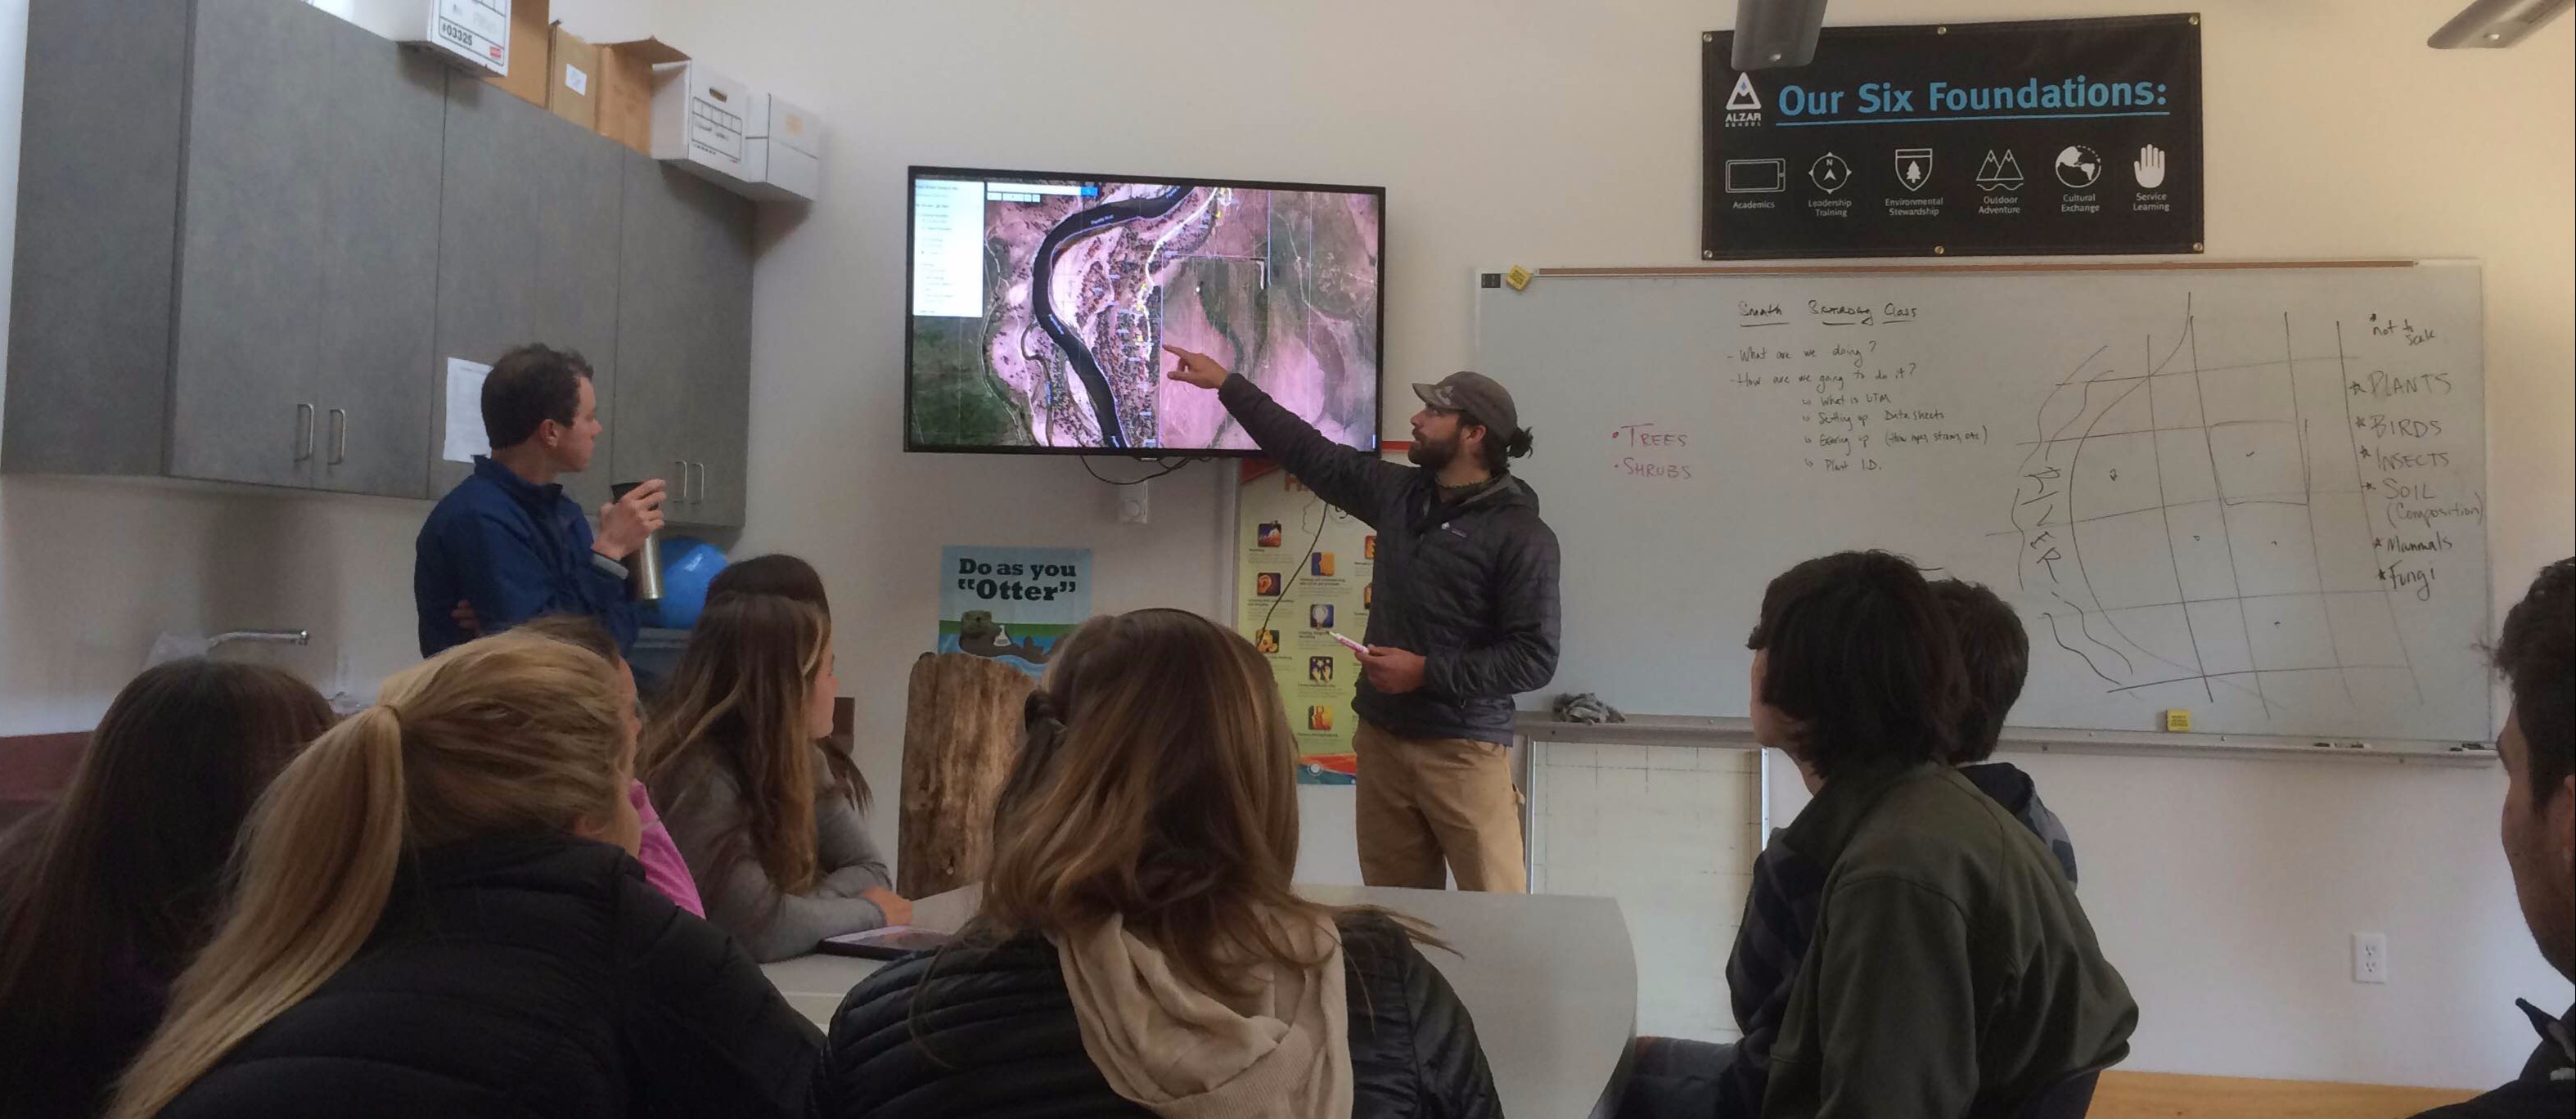
Things started off in the classroom as we got students thinking about what kind of observations they may want to make in an ecosystem. Plants, insects, fish, birds, fungi, mammals, and soil all came up quickly. We helped narrow the field for today’s study by listing off a few of the primary large plant species we see on campus and gave students an idea of exactly what data we’d like to have collected by lunch time. Next, we explained how students could quantify their location on campus. Students learn about latitude and longitude at early ages, but it isn’t typically until students start doing small-scale mapping projects that they learn about the incredibly useful and intuitive Universal Transverse Mercator (UTM) coordinate system. This system divides the surface of Earth into 60 equal zones that can be approximately flattened and overlays a traditional x-y Cartesian coordinate system over the top. Coordinates are then assigned in units of meters. Using a campus map with a UTM grid, students chose 50m x 50m sectors to survey in groups of three.
Once our pre-lab briefing was done, Ned took students outside where they created their own plant identification guides for lodgepole pines, aspens, sage brush, willows, black hawthornes, golden currants, wild roses, thistles, and mullen. Over the course of the next two and a half hours, students were tromping around the forest with tools in hand as we located their sectors by GPS, then set to work counting population data for everything they could find. In addition to the tree survey, students noticed rare (for our campus) ponderosa pines, fox dens, bird nests, enormous ant hills, and thousands of lodgepole saplings that have sprouted since we put up the fence to keep cows out three years ago. Some noticed cattails from a seasonal wetland area. Others saw young aspen shoots as they grow up from the root matrix of nearby adult trees.
Every group finished up their population survey and started taking measurements of tree height for some of the many thousand adult lodgepole pines creating the forest. With a river rescue rope to measure a horizontal distance and inclinometers improvised from their smartphones, students constructed imaginary right triangles over and over again that will let them calculate tree height using trigonometry.
Most importantly, students got an opportunity to see what field science is all about. They quickly got into a rhythm in their small groups. They settled on a procedure for covering their square so nothing would go unnoticed. They teamed up to collect and record data. Once students got momentum, it felt like I just had a great excuse to just walk around in the woods with my dog, checking in on various teams.
Here is a work in progress. As students submit their data, we’ll be able to share where different plant species are concentrated and how many of the uncommon trees actually grow here.
The final portion of this project will come during the next week. While on the Owyhee Backpacking expedition (and applying all of their map navigation skills), everyone will be processing the wealth of data that has been collected and seeing how statistical terms – like mean, standard deviation, and percentiles – can be used to describe a data set. Data that they, as scientists, can feel connected to.