Interpreting parabolic models
Parabolas. As most students explore mathematics, they are the first type of graph that deviates from the world of straight lines. They represent a function with a smooth curve and a peak in the middle. Parabolas are symmetric about a vertical axis. The equation that will yield a parabolic graph is typically a variation of y = x2.
In our pre-calculus course this last week, we have been studying some of the finer points of parabola and the quadratic equations that represent them. Students are learning how to find the maximum or minimum value, x-intercepts, and y-intercepts given an equation. All of this information can be determined using certain formulas or using a graphing calculator as a tool.
Just as importantly, students are learning why these tools are important. Parabolas are more than just nifty curvy things. Quadratic expressions appear regularly in a variety of applications. When objects free fall, their height as a function of time is represented by a parabola. Likewise, all simple projectile motion follows parabolic curves. In a problem using the picture below, a football is punted and the trajectory follows the curve of y = (-16/2025)x2 + 9x/5 + 1.2.
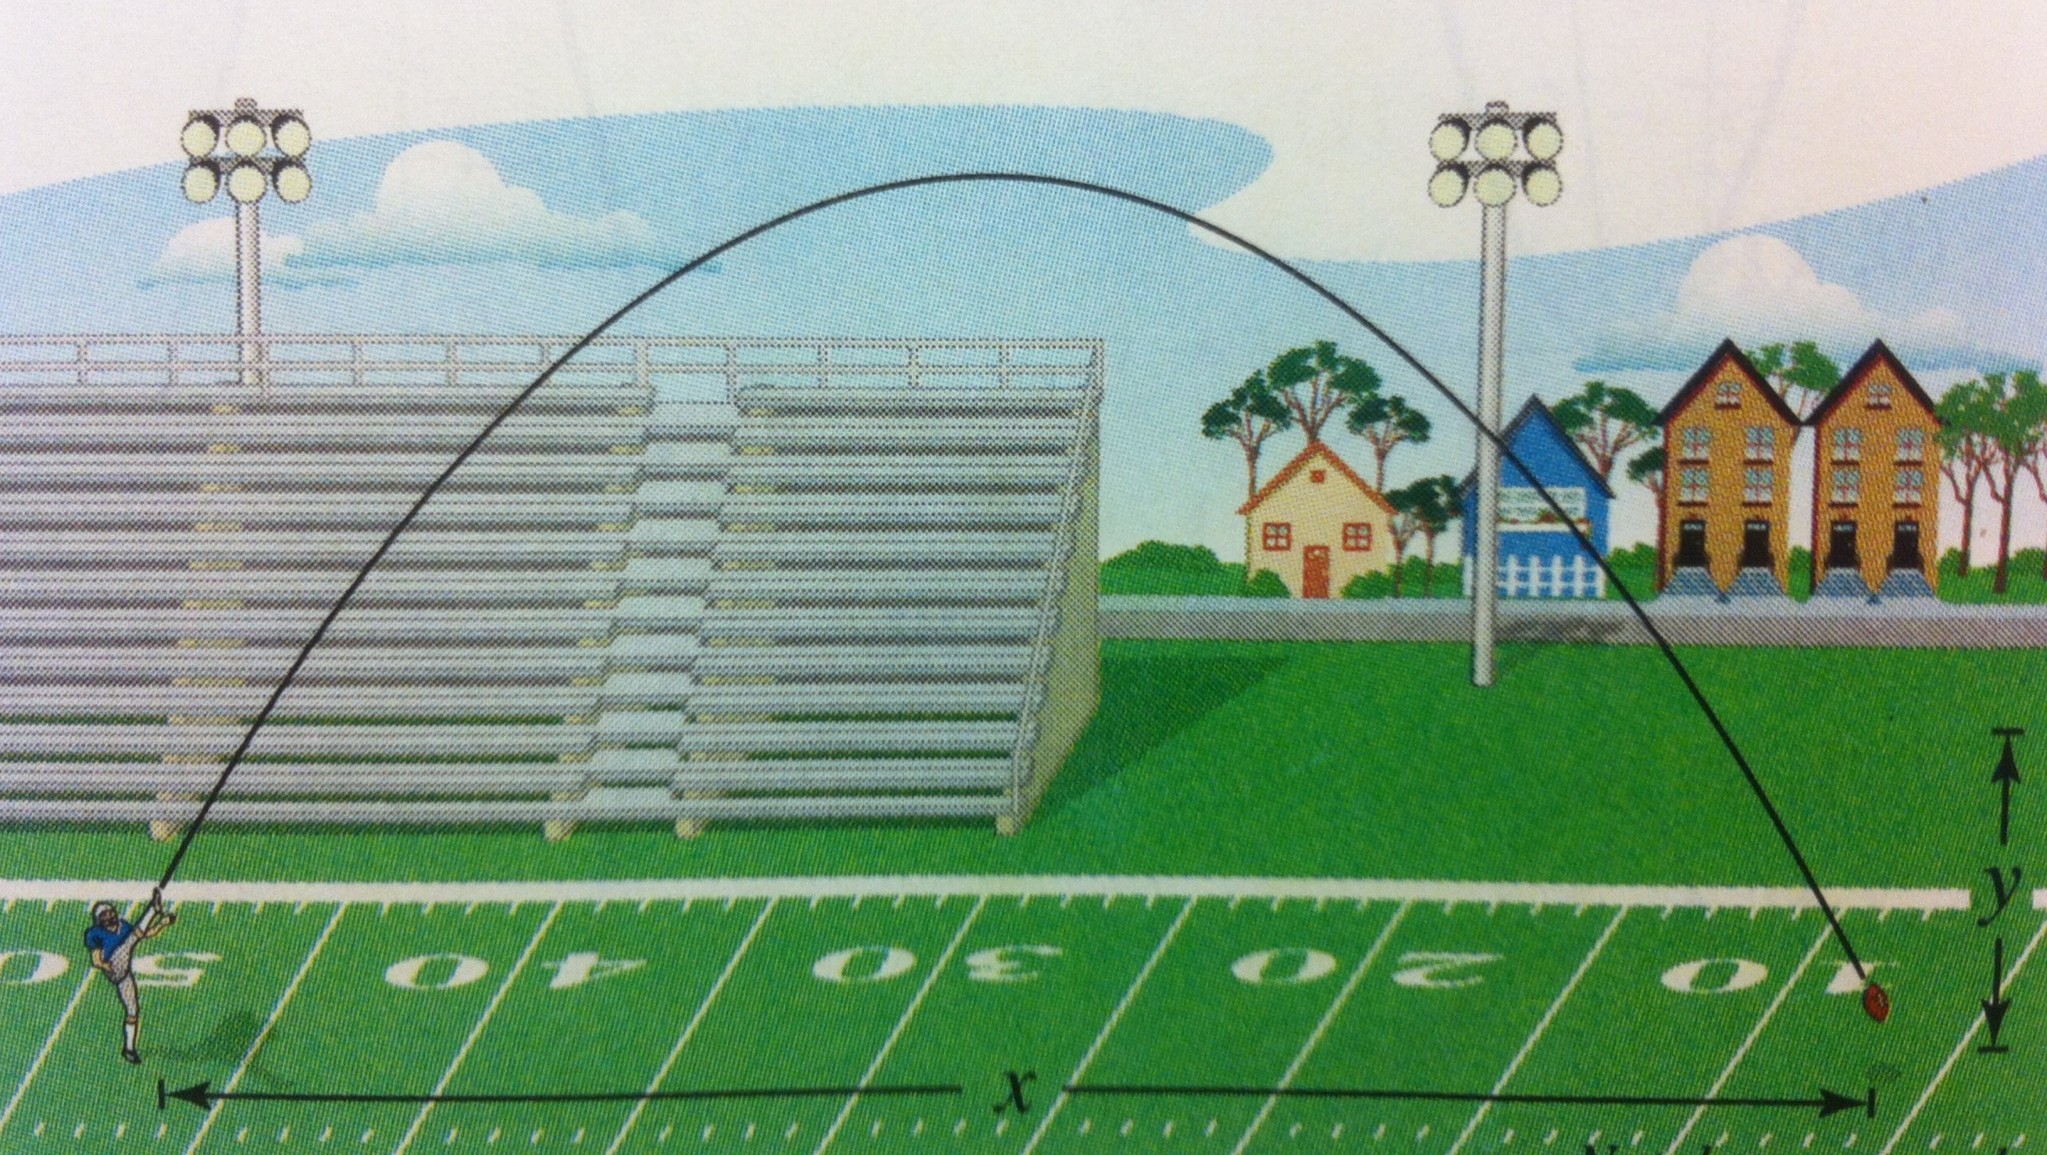
With that information, can you determine how high the ball was when it was kicked? How about the peak height of the ball during its flight or the distance the ball travels? Joaquin can.
Parabolic models appear elsewhere too. Cost/benefit analysis often leads to similar equations to punted footballs. Reflective surfaces on solar collectors follow parabolic curves, as does the satellite dish on your roof and the back casing of your car headlights. As pre-calculus students are exploring the world at Alzar School, they are beginning to notice numerous natural occurrences of the principles and relationships we study inside the classroom.
-Dan Thurber, Alzar School Math Teacher